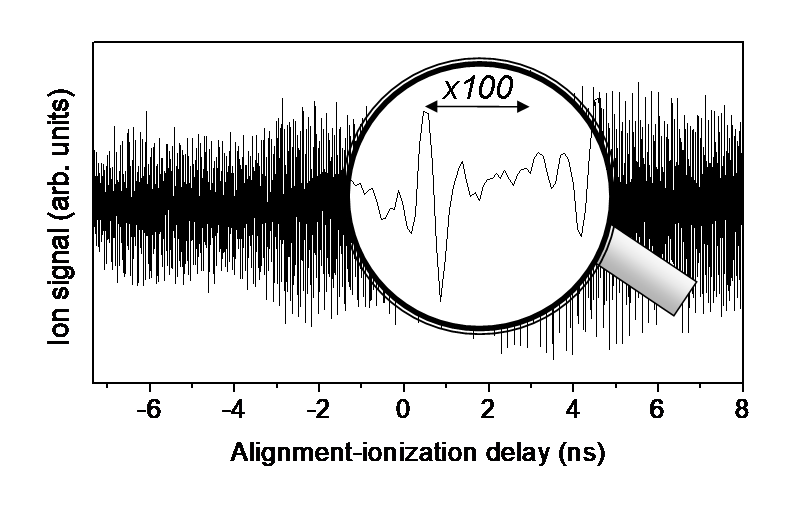
Our CRASY experiment measures rotational quantum waves of molecules. Usually we look at our data, but for the long traces we now measure this becomes a bit tedious and we really really have to zoom in to see anything. The example below is from a 17 nanosecond scan, but now we measure microsecond scans to get ever more precise data of our molecular structures.
How else could we explore our data?
Listen to it of course! So I slowed our data by a factor 50’000 to bring the Gigahertz frequencies into the audible range. Now you can hear our molecules rotate. The first example is our 300 nanosecond scan of the carbon disulfide rotational quantum-wave-packet. The molecule is linear and has a very simple harmonic spectrum.
So what do we actually hear? Like most things in the quantum world of atoms and molecules, the rotational motion is quantized and occurs only with discrete frequencies. We take snapshots of the molecular orientation at different points in time (in a mass spectrometer). Just like a rotating loudspeaker sounds louder when turned towards you, our signals are stronger when the molecules are oriented in a particular direction.
The hissing noise in the beginning is the signal from individual measurements. As we fill in more data points, the discrete molecular frequencies start to emerge. The spectrum is not quite harmonic because the molecules distort under the centripetal force of the rotation. This leads to the oscillating beating pattern at the end of the sound file.
To analyze the spectrum of frequencies, we can Fourier-transform the time-domain data and we get a spectrum as shown below. This data was published in PNAS.

Next, let’s listen to a 100 ns scan of 1,3-butadiene. This molecule is an asymmetric rotor and offers more complex harmonies. I’ll plot the corresponding frequency spectrum soon.
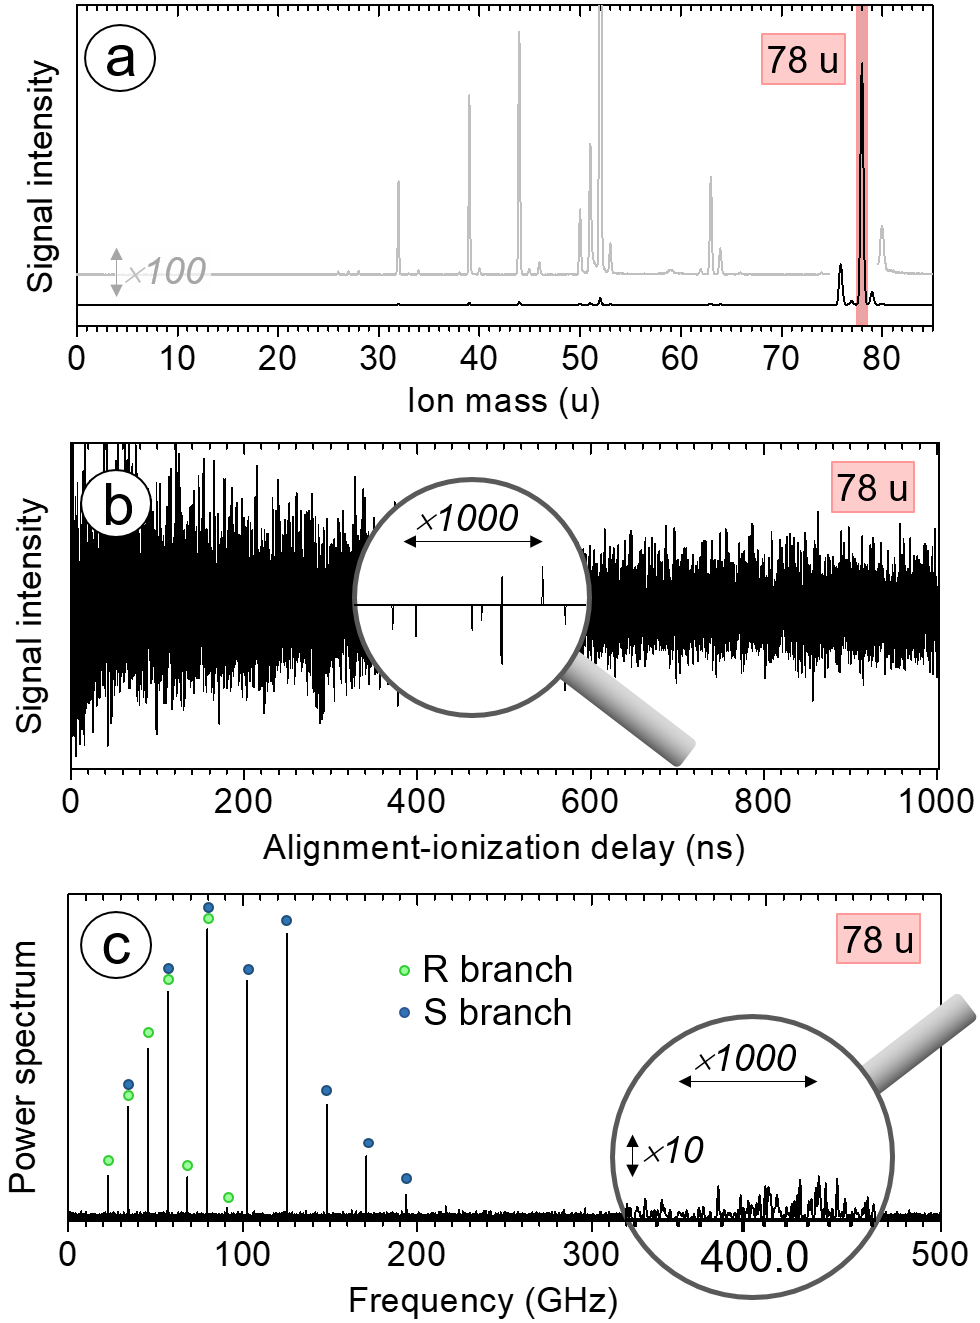
Finally the rather lengthy 1 microsecond scan of benzene. This molecule is a ‘symmetric rotor’ and has a much simpler spectrum than butadiene.
Below I plot some graphs from this 1 microsecond data-set. This scan was the longest time-domain measurement ever performed by us. The resolution is directly proportional to the scan length (Heisenberg’s time-energy uncertainty) and we obtained order-of-magnitude better resolution than any preceding Raman spectrum. The data is published in PCCP.
We actually observe our molecules in a mass spectrometer, so first we look at the mass spectrum to identify the molecules. Mass 78 is the mass of benzene, so in the second row we plot only this signal amplitude, but now as function of delay time. This second trace nicely illustrates the trick we use to get to large delays without too much effort: we skip most point and only measure data at a random subset of delays. This explain the grainy noise in the beginning of all the sound files: We don’t have enough information to piece together the waves from the few measured data points. The bottom graph shows the Fourier-transformed data from the middle graph. We can see the nice harmonic (evenly spaced) spectrum of benzene.
From the measured rotational frequencies, we determine the molecular shapes. But that story is better left for another post.